
Statistics
Stats of malware recollection
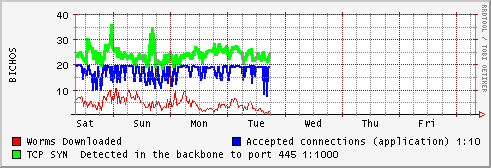
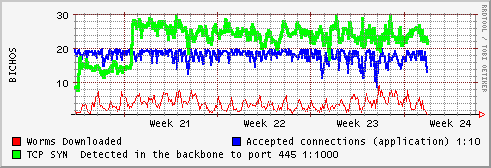
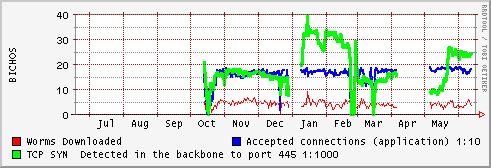
After some configuration changes the 445/TCP traffic was redirected to a special router , a Linux machine with it's IP tables configured to perform a reverse NAT accepting up to 200 TCP/SYN connections a minute. and running mwcollect to simulate a vulnerable windows system. Below there are some graphs that show the connections.
The application don't run fine with to much connections , the blue line show the accepted connections divided by 10 , so 20 is about 200 connections per minute.
Green Line show the "TCP/SYN" packets detected via IP tables in the system, surprisingly the number is similar to the accepted connections, but in a scale 1:1000), so approximately we are accepting 1% of the worms attacking our systems.
Red Line show the number of worms , bot, etc, downloaded by the application, the version of mwcollect is quite old and don't parse some of new attack vectors, but the number of worms is still quite good, about 6000 files downloaded every day, with about 11 to 20 new different specimens.
The typical rrdgraph graphs:
We hope to have better statistics soon.